
 Now!")

With so many articles and videos on popular media channels advising you not to look at your 401(k) during this market downturn, avoiding taking the other side is tough. If you are close to retirement or retired, isn’t a market downturn a good excuse to look at your 401(k)? After all, you’ve stashed away hard-earned money to enjoy those big post-retirement plans.
The stock market is well-known for its uncanny ability to throw you surprises, but the recent headline-driven price action is especially difficult to navigate. While it’s true that, over the longer term, the broader market tends to trend higher, if you’re not in a position to patiently wait for that to occur, you may want to reevaluate your portfolio sooner rather than later. The “set-it-and-forget-it” strategy can work at times but not always.
Is the Stock Market Headed Lower?
Let’s look at where the overall stock market stands by analyzing the S&P 500 ($SPX), starting with the daily chart.
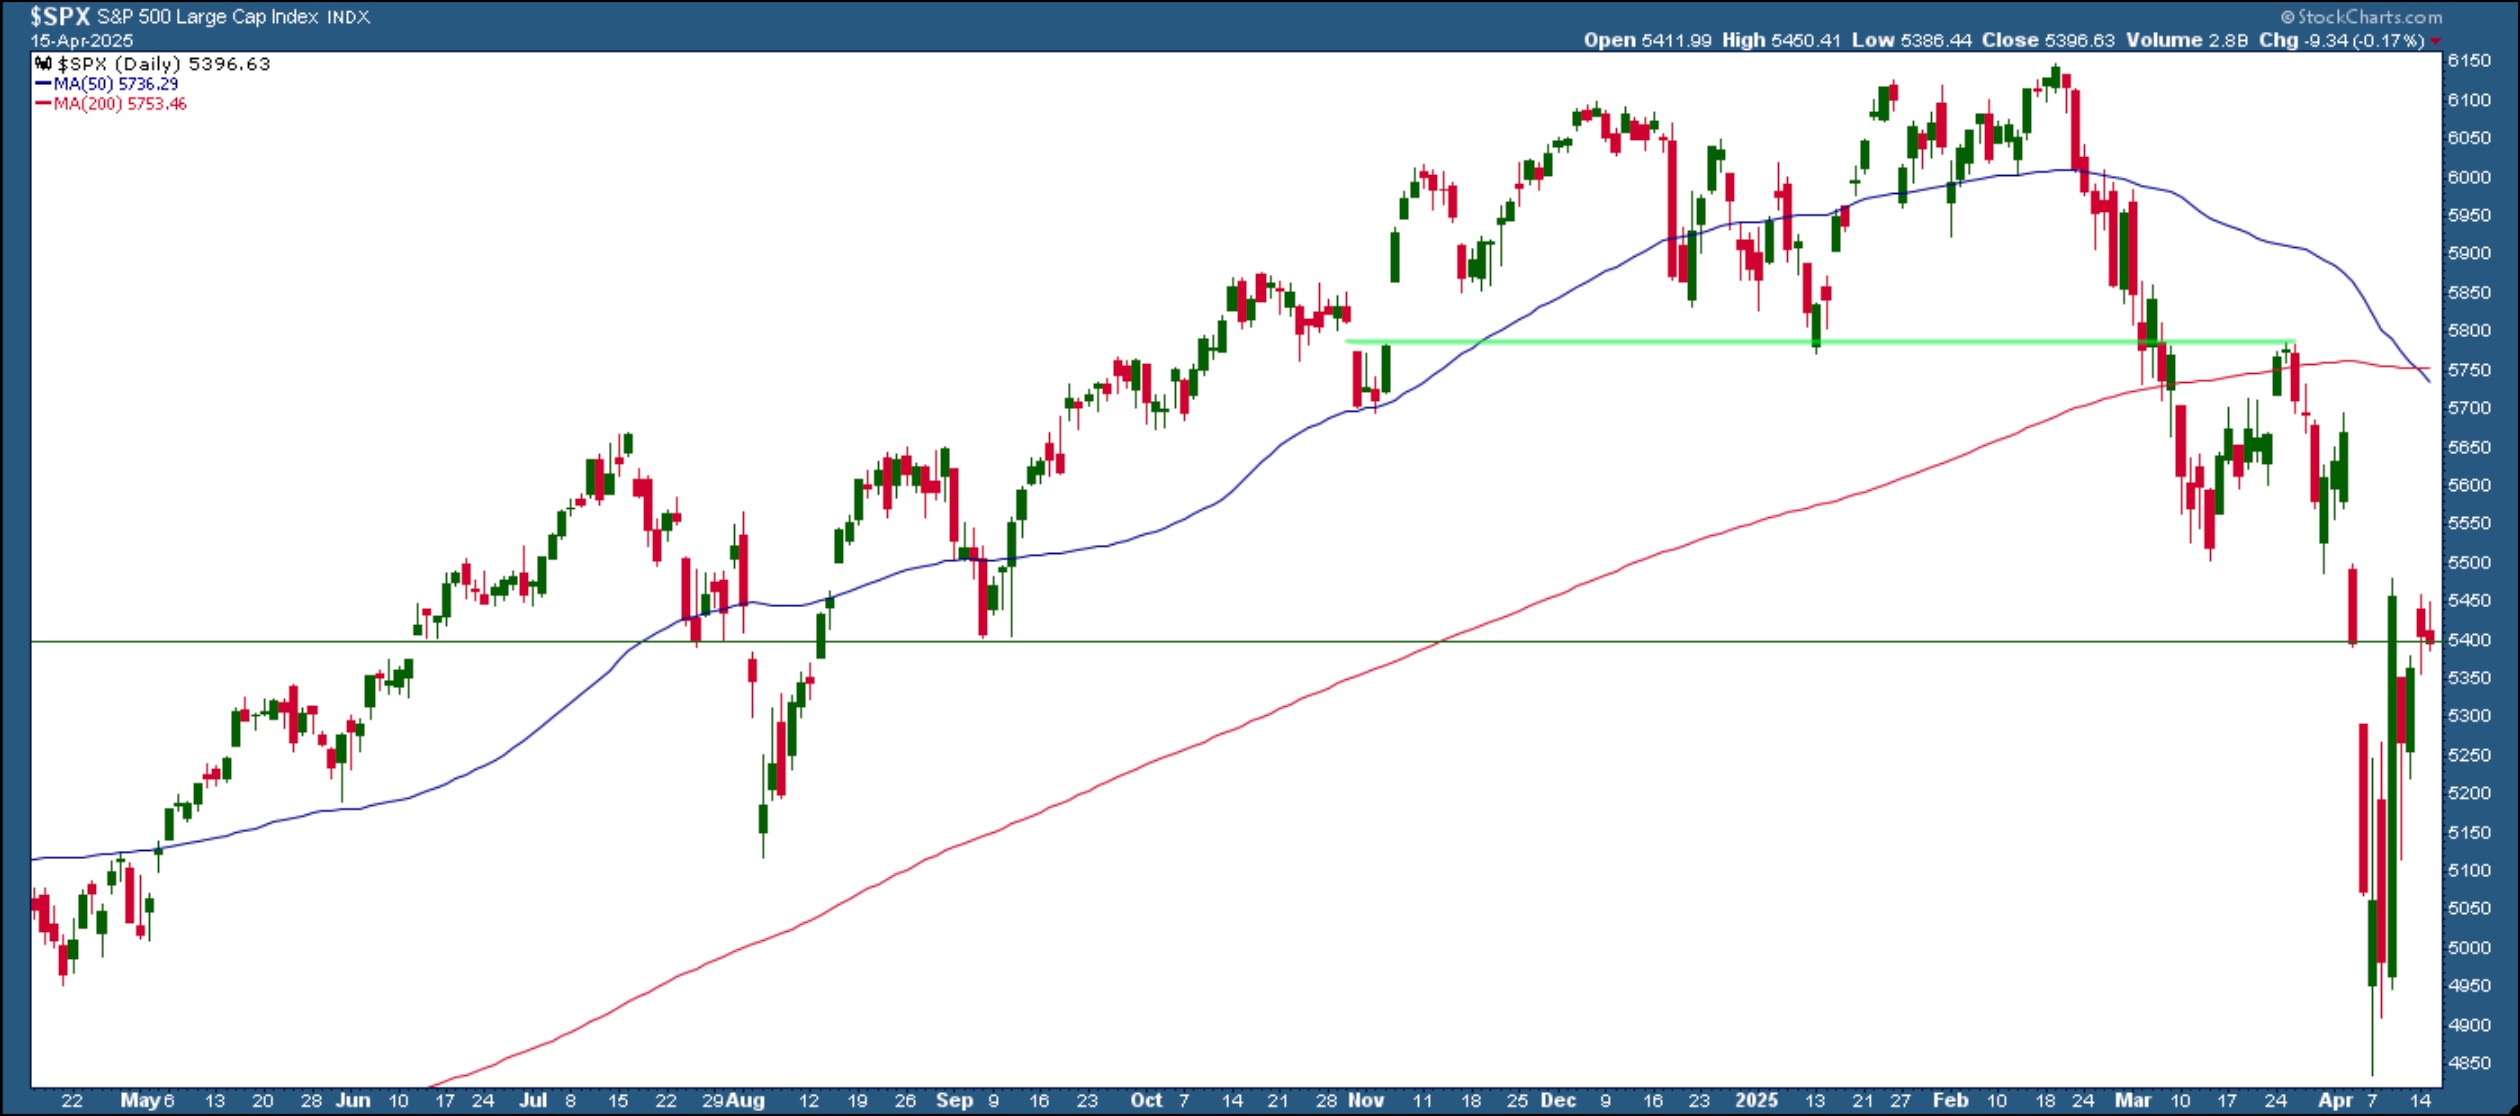
FIGURE 1. DAILY CHART OF S&P 500. After falling below its 200-day moving average, the S&P 500 is struggling to remain above at its 5400 level. Will it hold? Chart source: StockCharts.com. For educational purposes.
It’s clear the S&P 500 is trending lower and that the 50-day simple moving average (SMA) has crossed below the 200-day SMA, further confirming the downward trend of the index. After reaching a high of 6147.43 on February 19, 2025, $SPX started its decline, falling below its 50-day SMA and then its 200-day SMA.
Although the index tried to bounce back to its 200-day SMA, it failed to break above it and fell to a low of 4835.04 on April 7, 2025. Since then, the S&P 500 has been trying to bounce back. It filled the April 4 down gap, but has been stalling around the 5400 level since then, on lower volume. It’s almost as if investors are sitting on the sidelines for the next tariff-related news which could send the S&P 500 higher or lower.
Going back, the 5400 was a support level for the September 2024 lows, between the end of July and early August, and in mid-June. There have also been price gaps at this level during those times. The chart of the S&P 500 has a horizontal line overlay at the 5400 level. This could act as a resistance level for a while, or the index could soar above it, in which case this level could act as a support level.
Save the chart in one of your ChartLists and watch how the price action unfolds for the next few weeks.
Where’s the Breadth?
It’s worth monitoring the Bullish Percent Index (BPI) of the S&P 500. The chart below displays the S&P 500 Bullish Percent Index ($BPSPX) in the top panel and $SPX in the bottom panel.
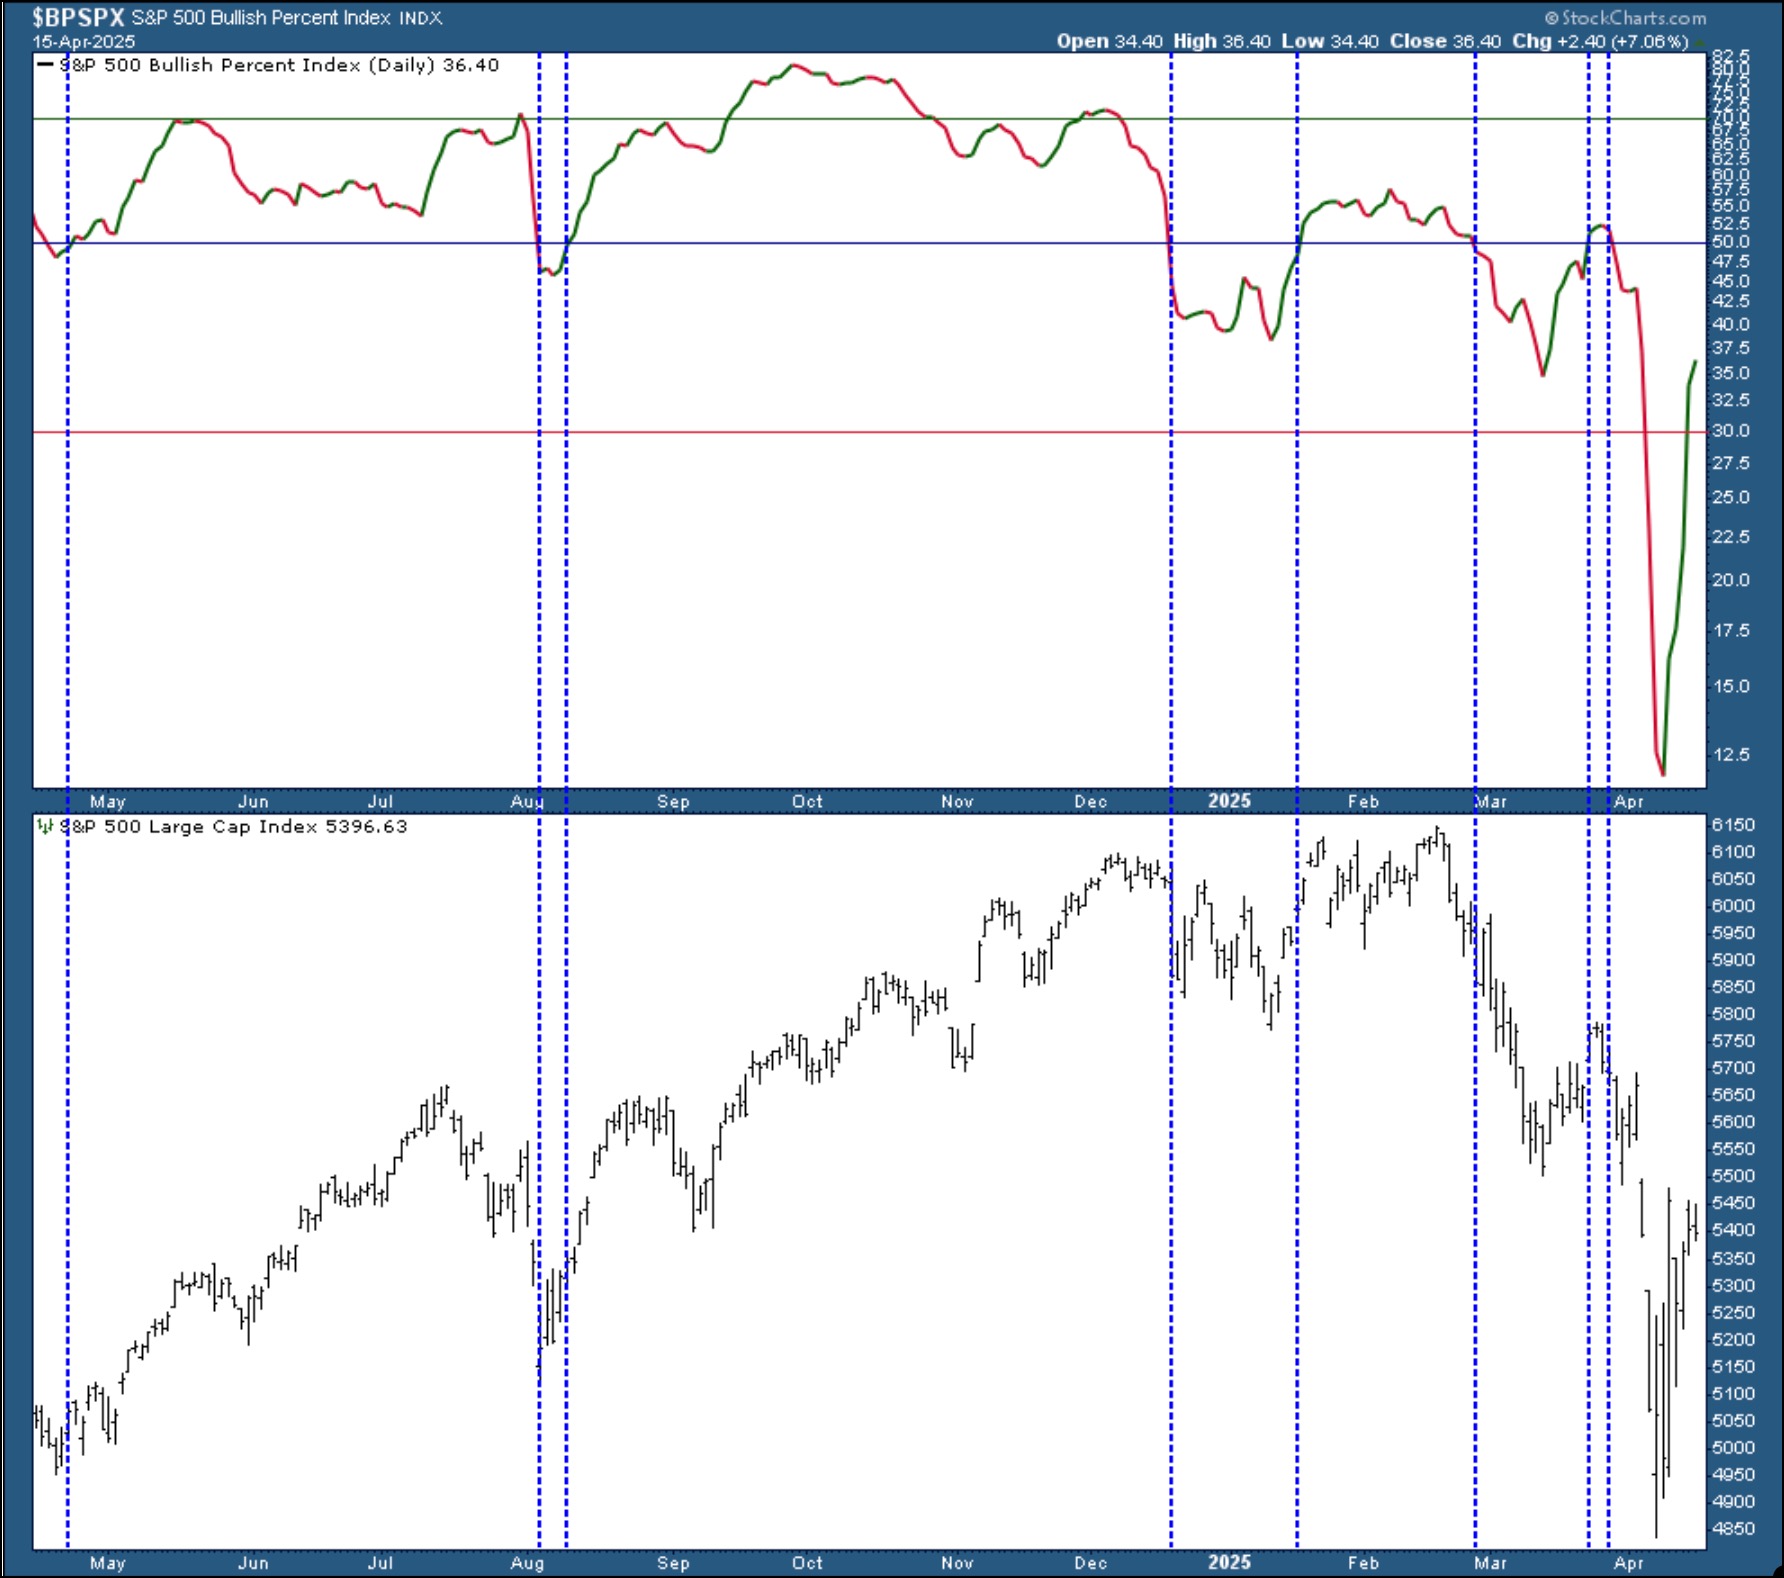
FIGURE 2. BULLISH PERCENT INDEX FOR THE S&P 500. The $BPSPX recovered after falling below 12.5. Even a move over 50 should be eyed with caution. Chart source: StockCharts.com. For educational purposes.
The recent slide in the S&P 500 took the $BPSPX to well below 12.5. It has reversed and is above 30, which is encouraging. A rise above 50 is bullish but, as you can see in the chart, the last time $BPSPX crossed above 50 (dashed blue vertical lines), it turned back lower, only to start its descent to the lowest level in the past year. Save your excitement until the $BPSPX is over 50 and a turnaround in the $SPX is in place.
This could take a while, which is why, if you’re close to retirement or already retired, you may have to consider selling the rip, or if the situation turns bullish, buy the dip. It may be time to unwind, so evaluate your portfolio and make decisions that are aligned with your lofty retirement plans.
So, heck yeah! Look at your 401(k) now!

Disclaimer: This blog is for educational purposes only and should not be construed as financial advice. The ideas and strategies should never be used without first assessing your own personal and financial situation, or without consulting a financial professional.