

My main question going into this weekend was, “Will the S&P 500 finish the week above its 200-day moving average?” And while the S&P 500 did indeed finish the week above this long-term trend barometer, our main equity benchmark is now within the gap range from earlier this month.
We’ll get to that crucial S&P 500 chart a little later, but first, I’d like to explain why gaps matter, why the price action post-gap is so important, and then apply these lessons to the SPX.
The “Gap and Run” Scenario Suggests an Influx of Buyers
One of two things tends to happen after a gap higher within an uptrend phase. The first scenario, which I call a “gap and run” pattern, is when additional buyers come in to push the price even higher.
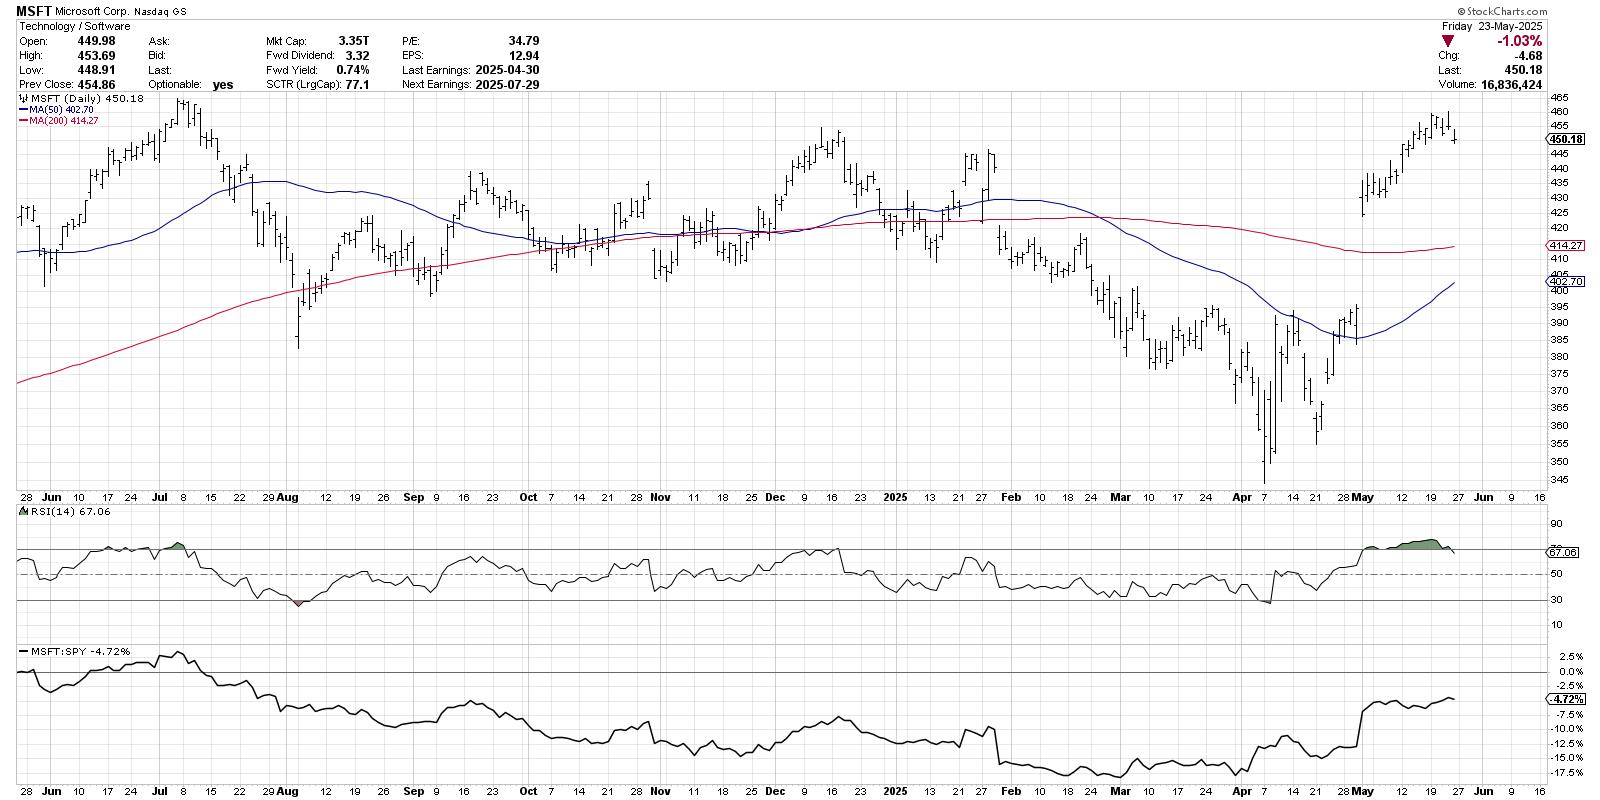
Microsoft Corp. (MSFT) features this gap and run pattern, with the gap higher on their Q1 earnings report followed by an additional appreciation in price. Basically, investors are not afraid to accumulate more MSFT, even after the stock gapped up from $395 to $430 overnight.
Did you catch our recent webcast, “Sell in May 2025: Seasonal Strategy or Outdated Myth?” We looked at the performance in May-June-July since the COVID low, then made a comparison between 2025 and the first half of 2022, when a break below the 200-day moving average was a sign of much further deterioration to come. Check out this excerpt on our YouTube channel!
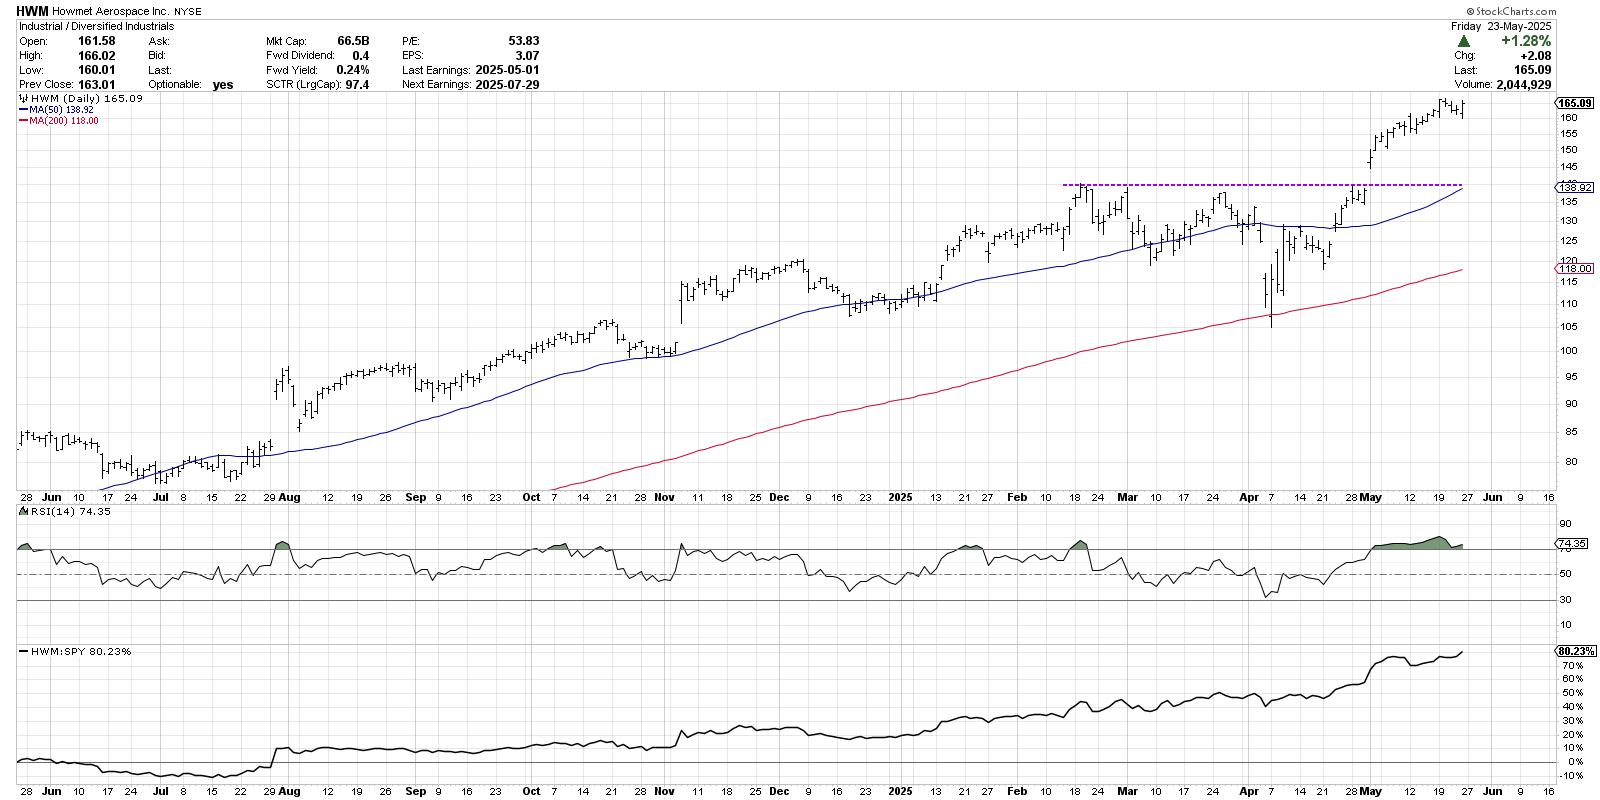
Shares of Howmet Aerospace (HWM) demonstrated a similar gap and run pattern recently, although this example is perhaps even more significant because the gap took the price to a new all-time high! Again, we can see that additional buyers are coming in and accumulating more HWM, fueling further gains after the gap.
The “Gap and Fail” Pattern Shows a Lack of Willing Buyers
Sometimes a chart will show a very different path after the gap, forming what I’ve termed a “gap and fail” pattern. Unlike the previous examples, here you’ll see that a lack of willing buyers causes the stock to quickly reverse lower into the range of the price gap.
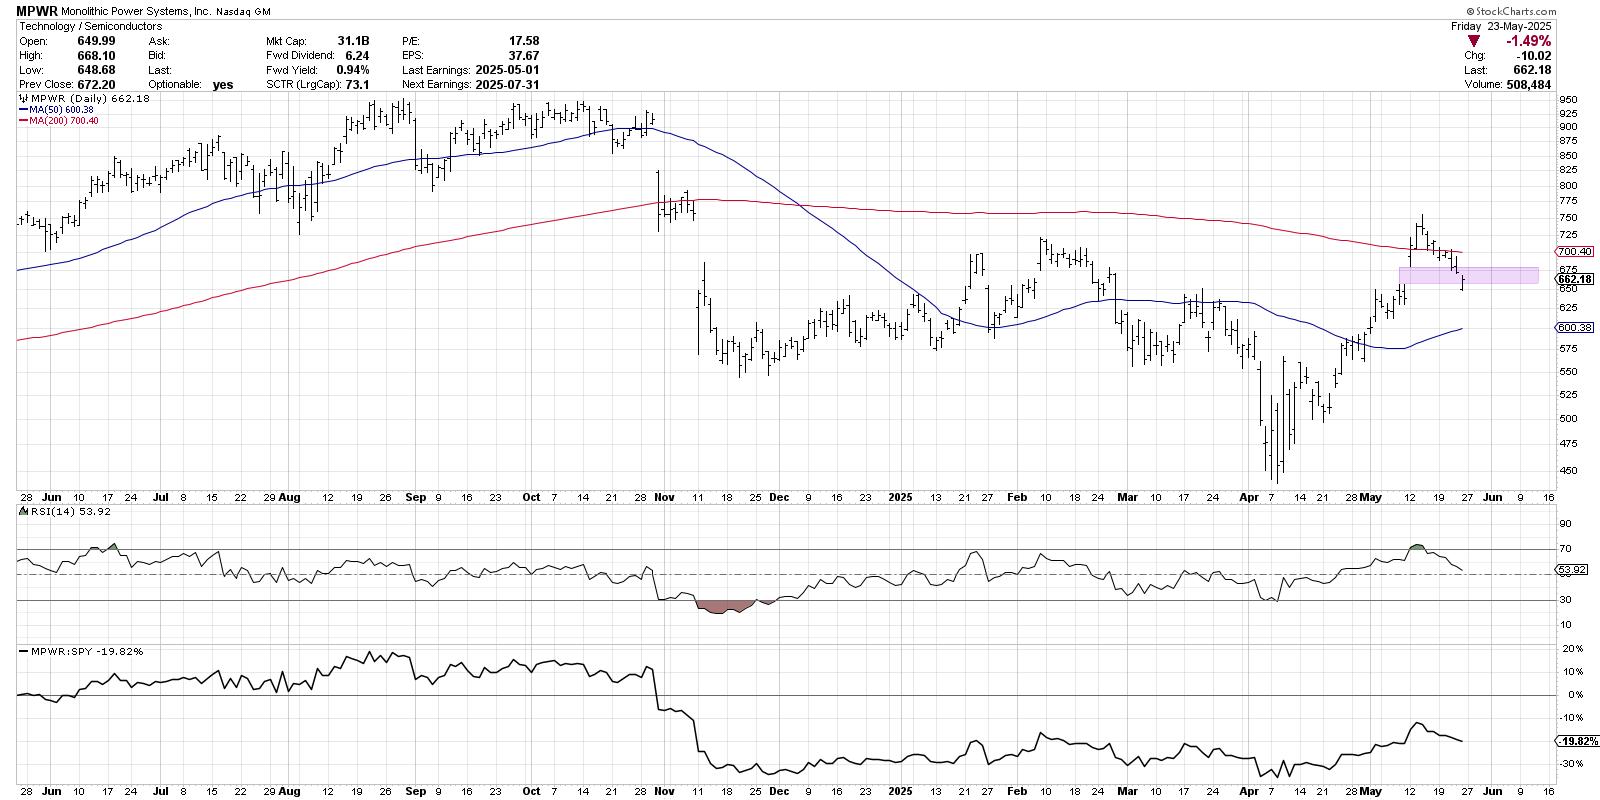
In the case of semiconductor producer Monolithic Power Systems (MPWR), the gap higher earlier this month was followed by two additional up days which propelled the stock above its 200-day moving average. This short-term pop higher was followed by a sudden downside reversal, representing an exhaustion of buyers after the upside gap.
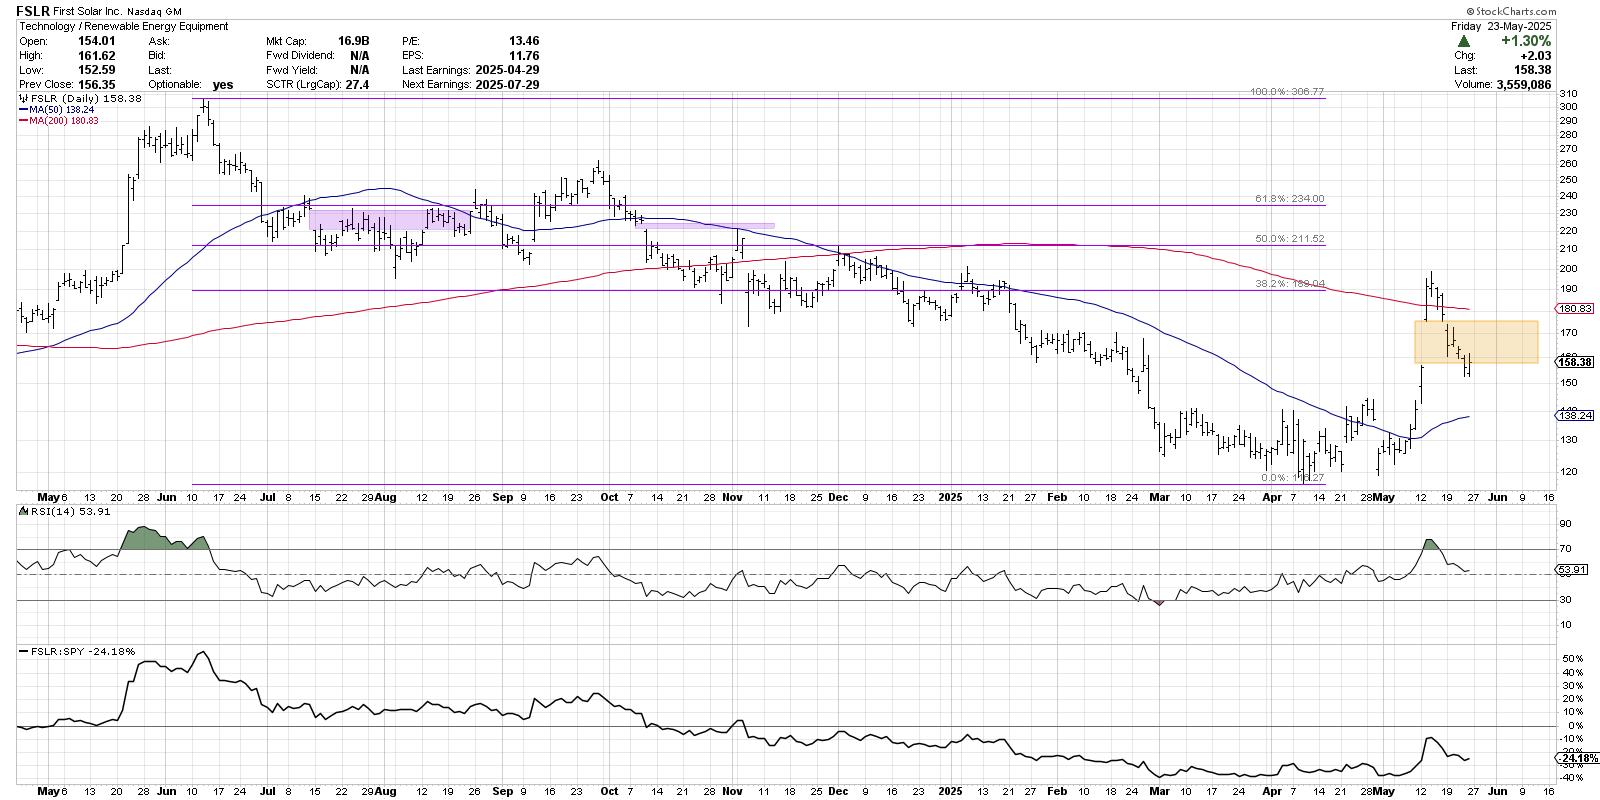
First Solar (FSLR) is demonstrating a similar pattern to MPWR, with a gap higher which pushed the stock just above the 200-day moving average to test the 38.2% Fibonacci retracement level. A couple days later, FSLR was back below the 200-day moving average, followed by further deterioration which eventually closed the gap from earlier in May.
The S&P 500 Could Test Its Own Gap Support
So what do those example charts have to do with the S&P 500? Well, the SPX traded higher for about a week after the upside gap in early May. We’ve drawn a green shaded range to highlight the gap from around 5725 to 5780. This gap includes the 200-day moving average and also lines up with the late March swing high.
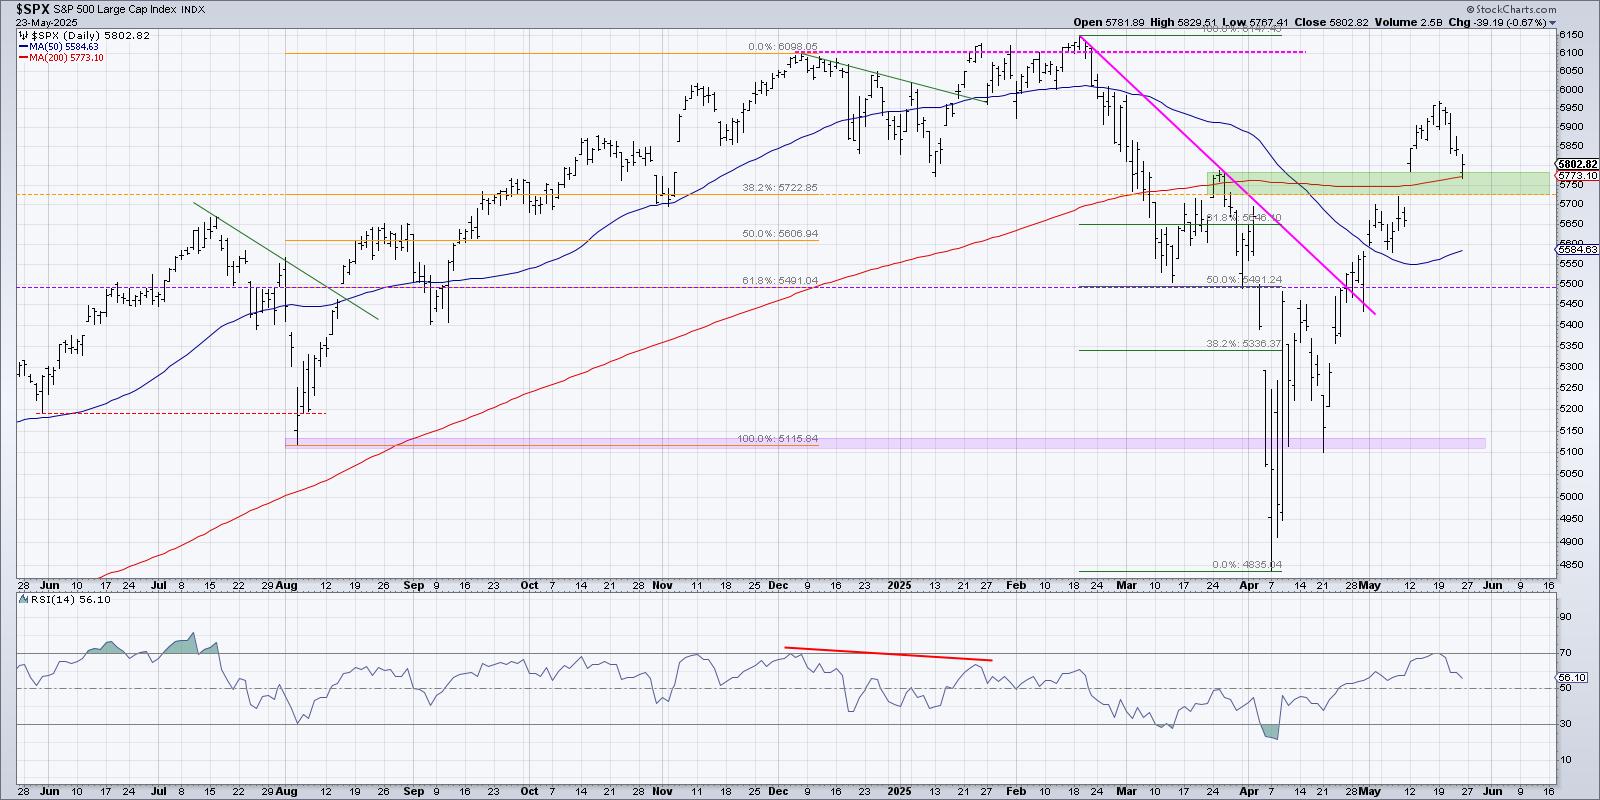
I see the S&P 500 as in a constructive pattern as long as it remains above this price gap range. If we can see an upswing after this week’s pullback, then this could just be a pause within a broader recovery phase for the S&P.
On the other hand, if we see any further price weakness from the major benchmarks next week, then the chart of the S&P 500 will start to look pretty similar to other “gap and fail” charts that confirm a lack of willing buyers. If we do see that downside follow-through next week, we’d expect further deterioration to the 5500 level, representing a 50% retracement of the February to April selloff phase.
RR#6,
Dave
PS- Ready to upgrade your investment process? Check out my free behavioral investing course!
David Keller, CMT
President and Chief Strategist
Sierra Alpha Research LLC
https://www.youtube.com/c/MarketMisbehavior
Disclaimer: This blog is for educational purposes only and should not be construed as financial advice. The ideas and strategies should never be used without first assessing your own personal and financial situation, or without consulting a financial professional.
The author does not have a position in mentioned securities at the time of publication. Any opinions expressed herein are solely those of the author and do not in any way represent the views or opinions of any other person or entity.