

 Stocks keep notching record highs. If you’re like most investors, you’re probably wondering, “Should I really chase these prices or sit tight and wait for a pullback?”
Instead of overthinking and ending up in Analysis-Paralysis land, however, it may be worth exploring other avenues — and maybe even something you’ve never thought of.
Enter bearish counter-trend options strategies. Yup, it sounds crazy, especially when the S&P 500 and Nasdaq closed at fresh highs. But here’s the reality: a well-planned put strategy has the potential to generate some revenue while you wait for the market to slow down or pull back. I got the idea after watching a recent video that dives into these strategies (worth watching if you haven’t).
Finding an Optimal Options Strategy
If you click the OptionsPlay Strategy Center tab on your StockCharts Dashboard (OptionsPlay Add-On for StockCharts required), choose the Bearish Counter Trend or Bullish Counter Trend categories (depending on whether the market is bullish or bearish), and then select the Bear Put Spread strategy, you’ll see all the stocks that meet the criteria. Since stocks are in a bullish trajectory, I decided to look at stocks in the Bearish Counter Trend list. I also chose the 45-day timeframe, a balanced risk profile, and $2,500 max risk. I sorted the list based on IV rank. Walt Disney Co. (DIS) made it to the top of the list.
A couple of points to consider:

- A risk/reward ratio of 0.6 to 1
- Disney’s earnings date of August 6, which falls before the spread expires.
However, looking through the other charts on the list, DIS appeared to be the most likely to pull back in the near term.
Here’s where the beauty of options comes into play. They’re extremely flexible, and you can tweak the strategies to give you a risk/reward that’s more desirable.
With that in mind, let’s dive into Disney’s stock chart and consider how low the stock could go.
Disney’s Daily Chart
Looking at the daily chart of DIS, the stock price has pulled back a bit, and momentum, although relatively high as indicated by the relative strength index (RSI) and percentage price oscillator (PPO), is showing signs of slowing down. If momentum continues to weaken, DIS could move lower and fall to around the $120 level (dashed blue horizontal line).
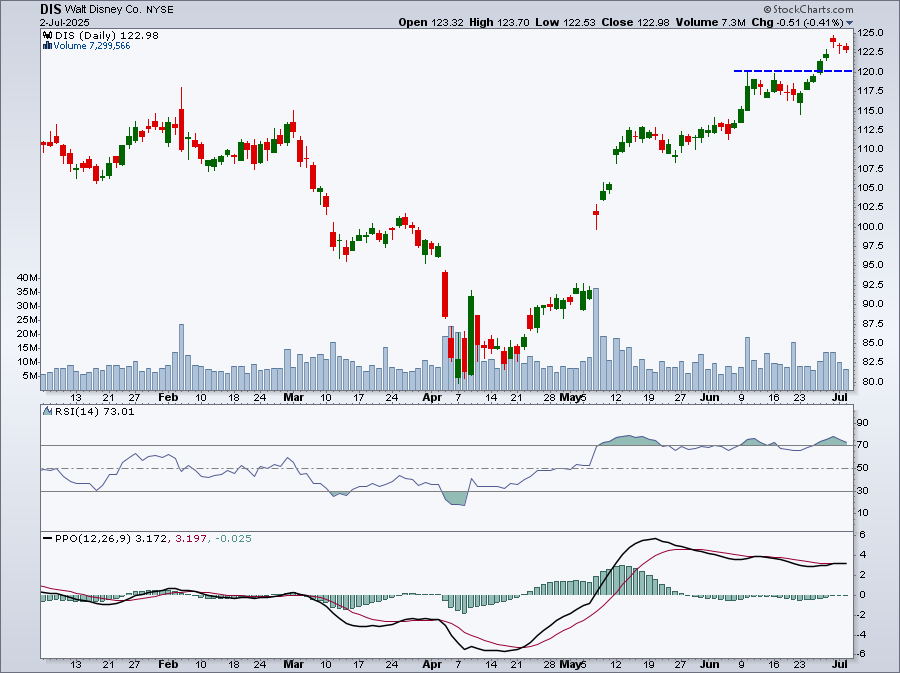
FIGURE 1. DAILY CHART OF DISNEY STOCK. DIS has been rising after its early May gap up. It’s now pulling back, and Disney’s stock price closed today at $122.98.Chart source: StockCharts.com. For educational purposes.
The Put Spread Can Bring a Little Magic
If you click the Options tab below the chart, you’ll see three strategies you could apply. Since I have a bearish bias, I clicked the Bearish button. The three optimized strategies that came up:
- Sell 100 shares of DIS.
- Buy one DIS put.
- Buy a put vertical. The put vertical has the highest OptionsPlay score and is the one that aligns with the bearish counter-trend strategy.
Looking at the risk curve for the put spread — buying 1 Aug 15 125 put and selling 1 Aug 15 110 put (see below) — you’re risking $471 for a potential reward of $1029. This is slightly better than a 0.6 to 1 risk/reward ratio. The breakeven level is $120.29, which aligns with the support level on the price chart. I would consider placing this trade.
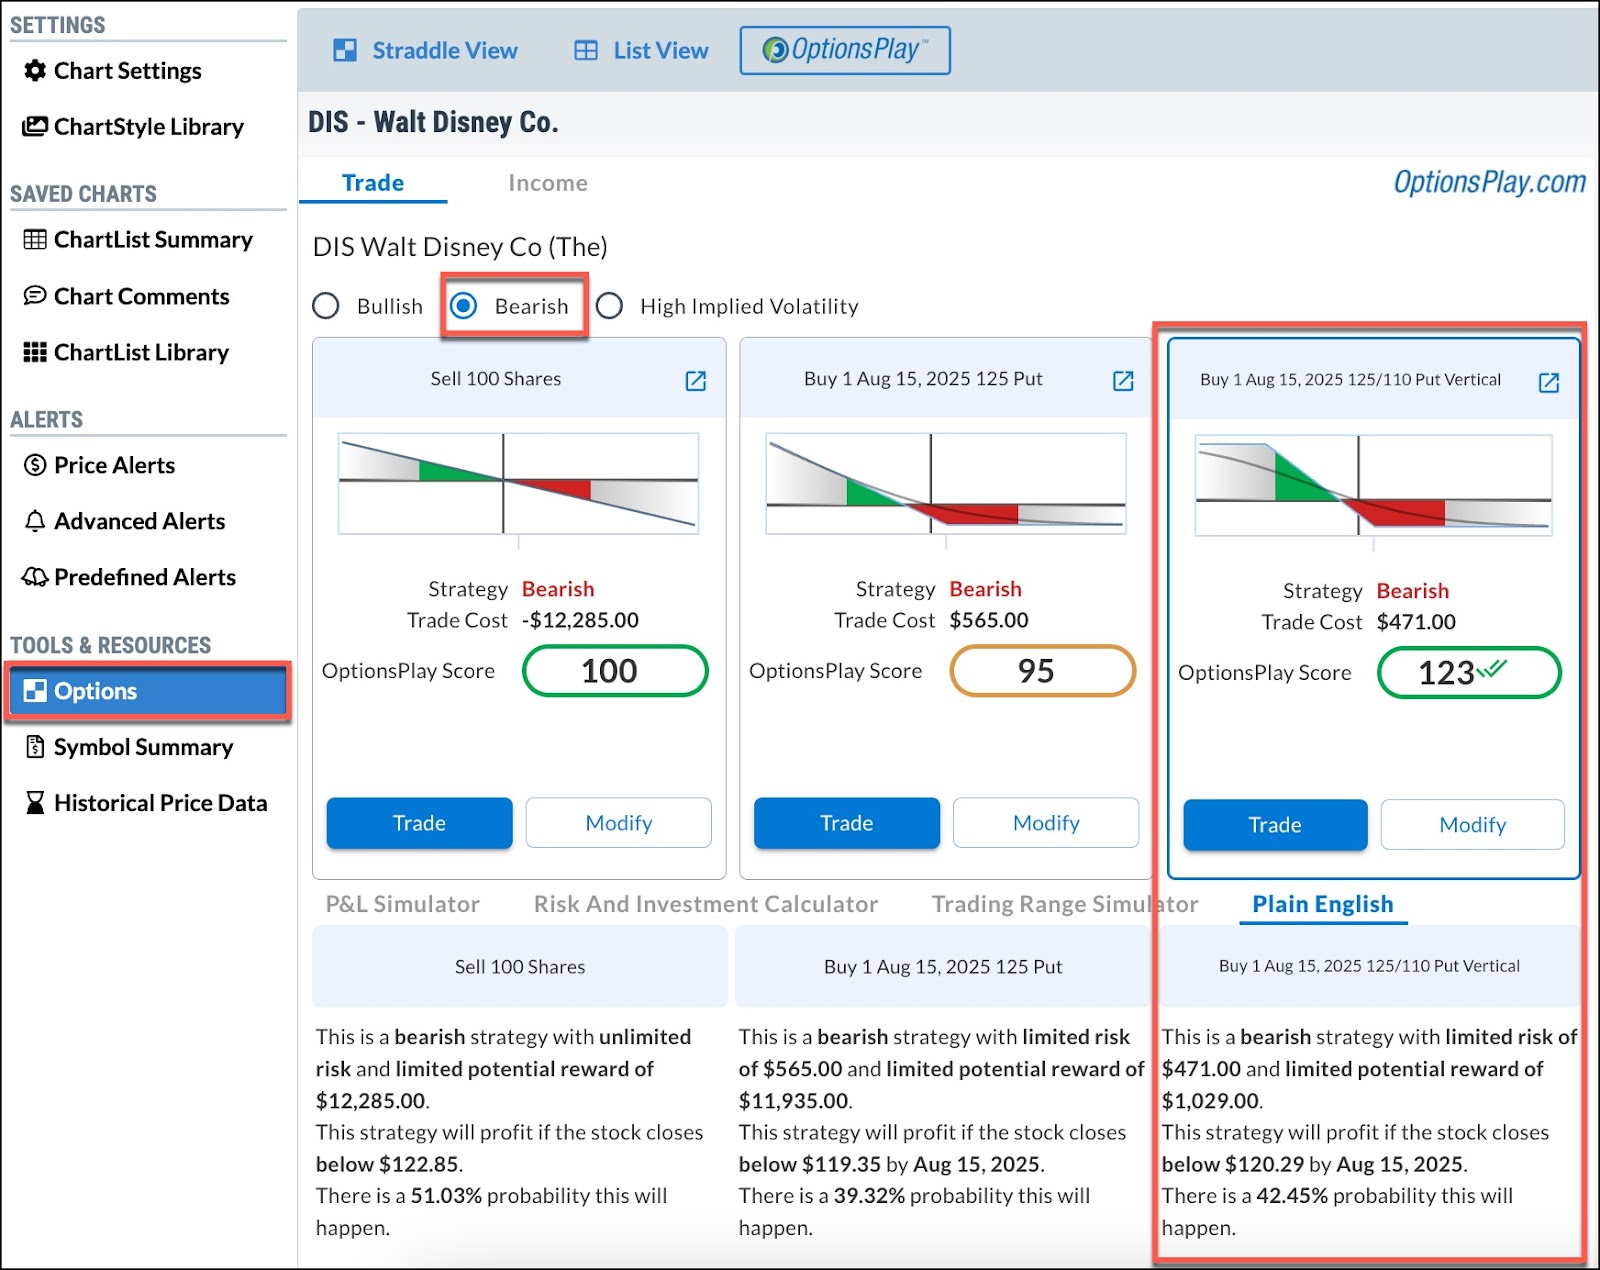
FIGURE 2: RISK CURVES FOR THREE OPTIMAL STRATEGIES FOR TRADING DIS STOCK. The put vertical spread has the best score, defined-risk, and an attractive payoff.Chart source: StockCharts.com. For educational purposes.
Final Thoughts
Options are dynamic, and if you decide to put on the trade, monitor your open positions regularly. With options, it’s not just about price. Time decay and volatility can change the premiums. If these variables change significantly, consider adjusting your trade.
Disclaimer: This blog is for educational purposes only and should not be construed as financial advice. The ideas and strategies should never be used without first assessing your own personal and financial situation, or without consulting a financial professional.